The Art of Statistics: How to Learn from Data by David Spiegelhalter is a 2019 science book about statistics, data literacy, uncertainty. Statistical thinking is a cycle: ask a question, collect data, analyze it, and communicate results — and where you start often determines what you find.
Summary
David Spiegelhalter is one of Britain's most prominent statisticians, and this book is his attempt to translate statistical thinking for a general audience without dumbing it down. The goal isn't to teach formulas. It's to give readers enough statistical literacy to evaluate the claims that flood modern life — medical studies, opinion polls, risk estimates, and data-driven journalism — without being misled by them.
Spiegelhalter works through the full pipeline of statistical reasoning: from asking the right question and collecting data, through visualization and modeling, to communicating uncertainty and interpreting results. Each step comes with real-world examples drawn from health data, crime statistics, and scientific controversies. He doesn't shy away from the ways statistics get abused — p-value fishing, cherry-picked baselines, misleading graphics — and he names them clearly enough that readers learn to spot them in the wild.
The book gives particular attention to communicating probability and risk, an area where even trained scientists often go wrong. Spiegelhalter's concept of the "expected frequency" — expressing a 1-in-100 risk as 1 person per 100 people, rather than 1% — is one of the most practical tools in the book. He also covers algorithmic prediction, Bayesian thinking, and the replication crisis in science with enough depth to be genuinely informative without requiring a math background.
The writing is accessible but not condescending. Spiegelhalter has a dry sense of humor and uses it to leaven what could easily be dry material. The book won't turn anyone into a statistician, but it should make any thoughtful reader harder to mislead. In an environment where data is invoked to justify almost any claim, that is a more valuable outcome than most books promise.
Talk to The Art of Statistics: How to Learn from Data like its author wrote you back.
Get the ideas that fit your life — not generic summaries.
- Chat with the book
- Audiobook-style main ideas
- Adapts to your life and goals
- Helps you take action
Key takeaways
- 1.
Statistical thinking is a cycle: ask a question, collect data, analyze it, and communicate results — and where you start often determines what you find.
- 2.
Visualizations can mislead as easily as numbers. Understanding how scales, baselines, and axis choices distort data is part of being data literate.
- 3.
Expressing risk as an expected frequency — '1 in 100 people' rather than '1%' — makes probability feel concrete and dramatically improves how people reason about it.
- 4.
P-values don't tell you the probability that a hypothesis is true. They tell you how surprising your data would be if the null hypothesis were correct — a far narrower claim.
- 5.
The replication crisis shows that even published, peer-reviewed findings often fail to hold up. Sample size, selective reporting, and researcher degrees of freedom all contribute.
- 6.
Algorithms and machine learning models produce predictions with confidence intervals, not certainties. Understanding that uncertainty is essential to applying them responsibly.
- 7.
Bayesian reasoning — updating a prior belief with new evidence — is more natural to human cognition than frequentist statistics, yet it's rarely taught in schools.
- 8.
Confusing correlation with causation is the most common error in data reasoning. Understanding what would need to be true for causation to hold is a distinct skill.
Discussion questions
Use these on your own, with a book club, or as chat starters in Superbook. Book club version, ready to copy or print →
- 1.
Spiegelhalter argues that statistical literacy is as important as reading literacy. Do you believe that? Where did your own statistical education fall short?
- 2.
Think of a health claim you've accepted based on reported statistics. What would you now look for to evaluate whether it was well-supported?
- 3.
The book shows how the same data can be presented to seem alarming or reassuring depending on the framing. Where in your media consumption do you notice this most?
- 4.
Spiegelhalter distinguishes personal risk from population risk. How do those two things interact when making decisions about your own health or safety?
- 5.
What's the most statistically dubious claim you've heard repeated as fact? What would you need to see to disconfirm it?
- 6.
The book covers the replication crisis. How should that change how much weight you give to any single study?
- 7.
Spiegelhalter makes the case for expressing probabilities as expected frequencies. Have you found that framing changes how risks feel to you?
- 8.
Where in your professional life do you make decisions based on data? What assumptions in that process do you rarely examine?
- 9.
What does it mean to say a statistical model is 'good'? Can a model fit data well and still be misleading?
- 10.
Spiegelhalter argues that good visualization is an art as well as a science. What makes a chart trustworthy versus manipulative?
- 11.
How do you personally communicate uncertainty to people who want a definitive answer — in your work or family decisions?
- 12.
The book ends with a discussion of algorithmic decision-making. What statistical responsibilities come with using an algorithm to decide who gets a loan, a job, or medical treatment?
Themes
Frequently asked questions
-
Is The Art of Statistics accessible without a math background?
Yes. Spiegelhalter writes for a general audience and avoids formulas almost entirely. The concepts require careful reading rather than calculation. Readers comfortable with careful nonfiction should find it manageable, and those with some prior statistics exposure will find deeper layers.
-
How long does it take to read The Art of Statistics?
Around six to seven hours at average reading pace. Chapters are organized as standalone lessons, which makes it easy to read in shorter sessions and return to specific topics when a real-world situation calls for them.
-
What is the main idea of The Art of Statistics?
That statistical literacy — knowing how to ask good questions, collect appropriate data, analyze it without self-deception, and communicate results with honest uncertainty — is a learnable set of skills, not a technical specialty reserved for experts.
-
Who should read this book?
Anyone who regularly encounters data-based claims and wants to evaluate them more rigorously: journalists, health professionals, policy advisors, and engaged general readers. It's especially useful for people who felt burned by oversimplified statistics courses that left them worse off than before.
-
How does The Art of Statistics compare to Nate Silver's The Signal and the Noise?
Spiegelhalter's book is more systematic and covers more statistical concepts — visualization, causation, algorithms. Silver's book is more narrative and domain-specific. The two books complement each other: Silver's is better on prediction and forecasting; Spiegelhalter's is better as a general statistical education.
Similar books
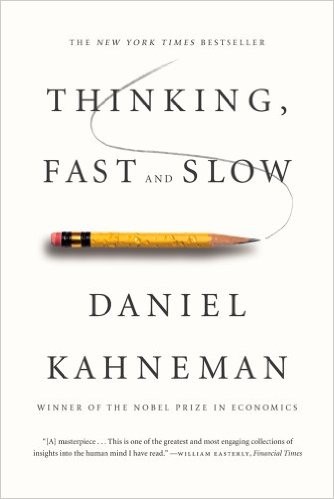
Thinking, Fast and Slow
Daniel Kahneman
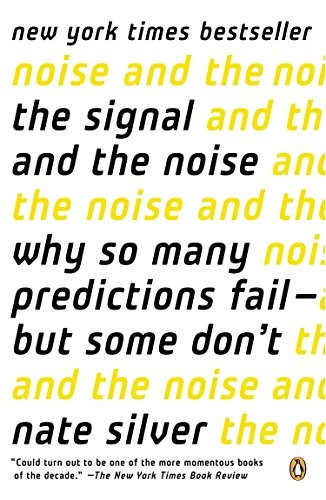
The Signal and the Noise
Nate Silver
Noise: A Flaw in Human Judgment
Daniel Kahneman, Olivier Sibony, and Cass R. Sunstein
Against the Gods: The Remarkable Story of Risk
Peter L. Bernstein